Your app shows you returns.
We show you why.
Stocks. Mutual Funds. Options. Bonds. Commodities. Forex. Crypto.
Institutional-grade analytics for Indian investors.
Upload your portfolio. See what’s really going on.
Upload your CAS statement, broker export, or screenshot. Get an instant institutional-grade diagnosis — attribution, stress tests, factor exposure.
Drop your file here, or browse
PDF, Excel, CSV, or screenshot · Max 10 MB
Supports: CAS PDF (CDSL/NSDL) · Broker Excel · App Screenshots
7 asset classes. One AI. Zero switching.
Stocks
3,193 stocks. 50+ ratios. 750+ preset screens. Backtest any criteria against 5 years of data.
Mutual Funds
10,000+ schemes. Fund comparison, rolling returns, CAS import. See what your funds are actually doing.
Options & Derivatives
Black-Scholes pricing, Greeks calculator, options chain, margin & position sizing.
Fixed Income
Bond calculators, YTM & duration, G-Sec rates, PPF/NSC/KVP, RBI rates.
Commodities
Gold, silver, crude oil — live prices by purity & weight. Built-in calculator.
Forex
22 currencies vs INR. Converter, rate lookup, regional filtering.
Crypto
Live prices, converter, historical charts. Track Bitcoin to altcoins.
AI Assistant
Ask questions in plain English about any stock, fund, or metric. Get instant explanations, not just numbers.
Stocks
3,193 stocks. 50+ ratios. 750+ preset screens. Backtest any criteria against 5 years of data.
Mutual Funds
10,000+ schemes. Fund comparison, rolling returns, CAS import. See what your funds are actually doing.
Options & Derivatives
Black-Scholes pricing, Greeks calculator, options chain, margin & position sizing.
Fixed Income
Bond calculators, YTM & duration, G-Sec rates, PPF/NSC/KVP, RBI rates.
Commodities
Gold, silver, crude oil — live prices by purity & weight. Built-in calculator.
Forex
22 currencies vs INR. Converter, rate lookup, regional filtering.
Crypto
Live prices, converter, historical charts. Track Bitcoin to altcoins.
AI Assistant
Ask in plain English. Get instant answers.
Which of your stock picks actually made money — and which ones just rode the market?
Your portfolio gained 18%. But was it your picks, your sector bets, or just the Nifty going up? Attribution breaks your returns into skill vs. market — so you stop repeating mistakes you don’t know you’re making.
What happens to your portfolio if the market drops 20% tomorrow?
Not a guess. A simulation based on your actual holdings, their correlations, and historical crash patterns. Most investors find out their downside risk the hard way. You don’t have to.
Are your 5 mutual funds actually giving you diversification, or just duplicating the same bets?
We check every holding across every fund. Most investors discover 60-70% overlap between funds they thought were different. That’s concentration risk hiding in plain sight.
A real portfolio. A real breakdown.
This investor’s IT overweight cost them 12% in allocation drag. They didn’t know until they ran attribution.
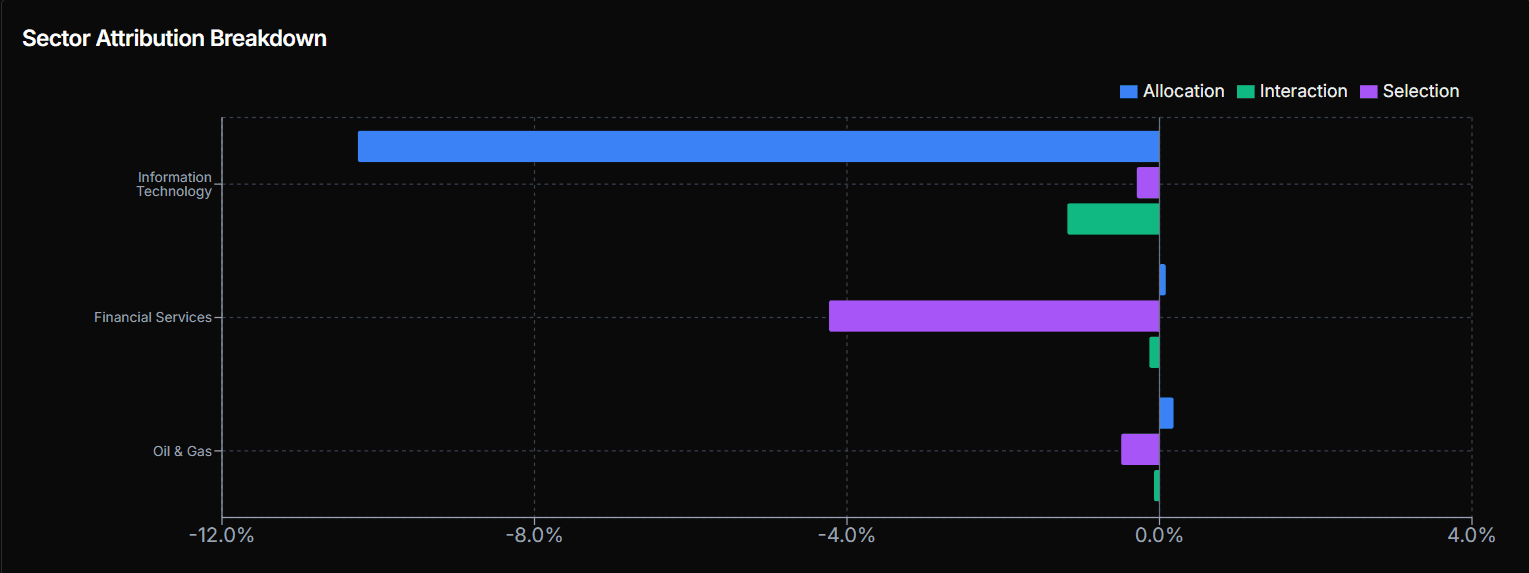
The IT overweight cost this portfolio 12% in allocation effect alone. Financial Services selection was negative too — the right sector, wrong stocks. This is what your portfolio looks like when you actually analyze it.
The investor thought they were diversified. The data showed they had a massive single-sector bet. Different assumption. Different strategy.
Two “different” flexi cap funds. Same bet.
Both labelled flexi cap. Both dominated by Large Cap and Banking. One has 93% style fit. The other, just 55%. Are they really giving you diversification?

You thought you owned two different funds. You own the same bet twice. Most investors discover 60-70% overlap between funds they thought were different. That’s concentration risk hiding in plain sight.
Screen on 20+ fundamentals. PE, ROE, debt-to-equity, Piotroski F-Score, Altman Z-Score. Backtest any criteria against 5 years of real market data.
All your funds in one view. Overlap detection, rolling returns comparison, rebalancing suggestions, and performance attribution by category.
GARCH volatility, regime detection, copula analysis, Monte Carlo simulation, jump diffusion, tail risk — the same models used by institutional desks.
VaR, CVaR, Sortino, Calmar, max drawdown, tracking error. Stress test against 2008, COVID, and custom scenarios with your actual holdings.
Thematic, sectoral, factor-based. Value traps, quality compounders, momentum breakouts, dividend aristocrats — curated by strategy, not just filters.
Fama-French market, size, value, and momentum factors calibrated for India. See which factors drive your returns and how much alpha you’re actually generating.
If you have ₹10L+ across stocks and mutual funds and you want to understand what’s actually driving your returns — not just track them — this is for you.
Risk analytics, stress testing, factor exposure — the institutional-grade layer your practice needs to serve clients professionally.
Sharpe, Sortino, VaR, attribution, factor models — stop studying in theory. See how they work on real portfolios.
Stop guessing.
Start knowing.
No credit card required. See what your portfolio is actually doing — and why.
IMPORTANT: This platform is not registered with SEBI as a Research Analyst or Investment Adviser. All content is for educational and informational purposes only and does not constitute investment advice. Screeners, valuations, backtests, and analytics are tools to filter and analyze data, not recommendations to buy, sell, or hold any security. Past performance and backtest results do not indicate future results. Please consult a SEBI-registered Investment Adviser before making investment decisions. Market data sourced from licensed providers.